Derails from Climate Change News thread.

Post Reply
User avatar
mistermack
Posts: 15093
Joined: Sat Apr 10, 2010 10:57 am
About me: Never rong.
Contact:

Re: Derails from Climate Change News thread.

Post by mistermack » Wed Jun 11, 2014 10:42 am

Four to five degrees? That's outside the IPCC's wildest estimate. Here'd the IPCCs own wild guesses, on their official loony website :


Not you Macdoc, but anyone who can actually read a graph will see that it's ALREADY wrong, at the bottom end.
The actual temperatures have been flat for the last seventeen years, while CO2 levels are still shooting up.

http://www.ipcc.ch/publications_and_dat ... spm-5.html
While there is a market for shit, there will be assholes to supply it.

User avatar
Hermit
Posts: 25806
Joined: Thu Feb 26, 2009 12:44 am
About me: Cantankerous grump
Location: Ignore lithpt
Contact:

Re: Derails from Climate Change News thread.

Post by Hermit » Wed Jun 11, 2014 11:12 am

JimC wrote:
Hermit wrote:
macdoc wrote:hehe

Some pointed perspective
Image
Cute, but palm trees on the north pole? Isn't that spot covered by water even now? :think:
With continental drift, there may well have been a land mass there...
Don't hold your breath. There hasn't been one in at least the past 120 million years, and there isn't one expected in the next 100 million years.

I am, somehow, less interested in the weight and convolutions of Einstein’s brain than in the near certainty that people of equal talent have lived and died in cotton fields and sweatshops. - Stephen J. Gould

User avatar
macdoc
Twitcher
Posts: 9012
Joined: Tue Feb 23, 2010 3:20 pm
Location: BirdWing Home FNQ
Contact:

Re: Derails from Climate Change News thread.

Post by macdoc » Wed Jun 11, 2014 5:25 pm

Macdoc, but anyone who can actually read a graph will see that it's ALREADY wrong, at the bottom end.
The actual temperatures have been flat for the last seventeen years, while CO2 levels are still shooting up.
because you say so??!!!! :funny: :funny: :funny: :funny:

YOU PUT UP A 2007 GRAPH :banghead: That's 7 fucking years ago.

fucking drowning in Koolaid - a slowing in global atmospheric temperature gain is not no gain.

And it's in the ocean and about to come back out as a nasty El Nino.
Go learn some basics ...your delusions are tiresome.
Image

Rahmstorf et al. Validate IPCC Temperature Projections,

Posted on 29 November 2012 by dana1981
A new paper in Environmental Research Letters by Rahmstorf, Foster, and Cazenave (RFC12) takes a very interesting approach in testing the Intergovernmental Panel on Climate Change (IPCC) global warming projections, and also examines its sea level rise projections. Consistent with the previous analyses at Skeptical Science, RFC12 finds that the climate models used in the IPCC 2001 Third Assessment Report (TAR) and 2007 Fourth Assessment Report (AR4) predicted the ensuing global surface warming to a high degree of accuracy, while their central sea level rise predictions were too low by about 60%.

Novel Approach to Testing Temperature Projections
One of the principle difficulties in testing relatively recent temperature projections is that there are a lot of short-term influences on global surface temperatures that introduce noise into the data. For example, there are oceanic cycles like the El Niño Southern Oscillation (ENSO, comprised of El Niño and La Niña events), an 11-year solar cycle, and particulates released during volcanic eruptions which cause short-term cooling by blocking sunlight. Many of these short-term influences are very difficult to predict ahead of time, and when averaging many model runs together as the IPCC does, these short-term unpredictable effects on temperature tend to average out to zero.

Thus the IPCC multi-model average of simulations do not reflect these short-term temperature influences, which is not a problem for long-term predictions, because positive and negative short-term cycles and noise average out to zero over long timeframes. However, when comparing model projections to observed temperatures over just a decade or two, the short-term noise can play a significant role. RFC12 takes a very clever approach to address this issue, applying the methodology of Foster and Rahmstorf (2011), using the statistical technique of multiple regression to filter out the influences of ENSO and solar and volcanic activity from the global surface temperature data (Figure 1).

before/after filtering

Figure 1: Global surface and lower atmosphere temperature data from 5 data sets (with a 12-month running average) before and after applying the statistical methodology of Foster and Rahmstorf (2011) to remove the influences of ENSO and solar and volcanic activity.

The paper then compares the global surface temperature data (with these three influences both included and removed) to the envelope of climate model temperature projections in both the 2001 and 2007 IPCC reports (Figure 2).

RFC12 Fig 1

Figure 2: Observed annual global temperature, unadjusted (pink) and adjusted for short-term variations due to solar variability, volcanoes and ENSO (red) as in Foster and Rahmstorf (2011). 12-month running averages are shown as well as linear trend lines, and compared to the scenarios of the IPCC (blue range and lines from the 2001 report, green from the 2007 report). Projections are aligned in the graph so that they start (in 1990 and 2000, respectively) on the linear trend line of the (adjusted) observational data.

IPCC Has Accurately Projected Global Surface Warming
As Figure 2 shows, the unadjusted data (pink) have tended to fall towards the lower end of IPCC projections in recent years, primarily due to the preponderance of La Niña events and an extended solar cycle minimum, which have short-term cooling influences on global surface temperatures. However, when these influences are filtered out (red), the observed temperatures fall very close to the central climate model projections, which RFC12 notes are based on greenhouse gas emissions scenarios that accurately reflect the observed CO2 changes over that timeframe.

In short, the global climate models used in the IPCC reports have been very good at predicting the underlying human-caused global surface warming trend, beneath the short-term noise which will average out to zero over time. This suggests that IPCC projections of future global warming, which are based on various possible human greenhouse gas emissions scenarios, are reliable.
http://www.skepticalscience.com/rahmsto ... -2012.html
Resident in Cairns Australia • Current ride> 2014 Honda CB500F • Travel photos https://500px.com/p/macdoc?view=galleries

User avatar
Jason
Destroyer of words
Posts: 17782
Joined: Sat Apr 16, 2011 12:46 pm
Contact:

Re: Derails from Climate Change News thread.

Post by Jason » Wed Jun 11, 2014 7:05 pm

macdoc wrote:

User avatar
macdoc
Twitcher
Posts: 9012
Joined: Tue Feb 23, 2010 3:20 pm
Location: BirdWing Home FNQ
Contact:

Re: Derails from Climate Change News thread.

Post by macdoc » Wed Jun 11, 2014 7:50 pm

Image
Resident in Cairns Australia • Current ride> 2014 Honda CB500F • Travel photos https://500px.com/p/macdoc?view=galleries

Seth
GrandMaster Zen Troll
Posts: 22077
Joined: Fri Jan 28, 2011 1:02 am
Contact:

Re: Derails from Climate Change News thread.

Post by Seth » Wed Jun 11, 2014 10:59 pm

macdoc wrote:hehe

Some pointed perspective
Image

I'm good with +1 to +2. I'm not so good with -1 or lower.

Bring on the carbon!
"Seth is Grandmaster Zen Troll who trains his victims to troll themselves every time they think of him" Robert_S

"All that is required for the triumph of evil is that good men do nothing." Edmund Burke

"Those who support denying anyone the right to keep and bear arms for personal defense are fully complicit in every crime that might have been prevented had the victim been effectively armed." Seth

© 2013/2014/2015/2016 Seth, all rights reserved. No reuse, republication, duplication, or derivative work is authorized.

User avatar
mistermack
Posts: 15093
Joined: Sat Apr 10, 2010 10:57 am
About me: Never rong.
Contact:

Re: Derails from Climate Change News thread.

Post by mistermack » Thu Jun 12, 2014 9:57 am

macdoc wrote:
Macdoc, but anyone who can actually read a graph will see that it's ALREADY wrong, at the bottom end.
The actual temperatures have been flat for the last seventeen years, while CO2 levels are still shooting up.
because you say so??!!!! :funny: :funny: :funny: :funny:

YOU PUT UP A 2007 GRAPH :banghead: That's 7 fucking years ago.
Of course I did, how else could you judge the success of a projection? Sometimes the ignorance of your posts amazes me. Even now.
If the projections were made yesterday, you would expect the lines up to today to be one single one, since they already know the answer. And you would have no way of judging their success in making predictions.

The only way you can do that, is to look at predictions they made a few years ago.
:banghead: :banghead: :banghead: :banghead: :banghead:
While there is a market for shit, there will be assholes to supply it.

User avatar
Tero
Just saying
Posts: 51260
Joined: Sun Jul 04, 2010 9:50 pm
About me: 15-32-25
Location: USA
Contact:

Re: Derails from Climate Change News thread.

Post by Tero » Thu Jun 12, 2014 1:44 pm

And the problem is? Even Seth will get his +1.

There is nothing outside of predictions in the text:

>>IPCC Has Accurately Projected Global Surface Warming
As Figure 2 shows, the unadjusted data (pink) have tended to fall towards the lower end of IPCC projections in recent years, primarily due to the preponderance of La Niña events and an extended solar cycle minimum, which have short-term cooling influences on global surface temperatures. However, when these influences are filtered out (red), the observed temperatures fall very close to the central climate model projections, which RFC12 notes ....<<

User avatar
mistermack
Posts: 15093
Joined: Sat Apr 10, 2010 10:57 am
About me: Never rong.
Contact:

Re: Derails from Climate Change News thread.

Post by mistermack » Thu Jun 12, 2014 8:24 pm

I'll post it again. This is the official IPCC model, which they gave out in the 2007 report.


The orange line is what they forecast if CO2 levels remained at year 2,000 levels. They haven't.
But temperatures are still actually below the 1997 levels, that are shown on the graph.

Way outside their forecasts. Because their forecasts are just wild guesses, dressed up as science.
While there is a market for shit, there will be assholes to supply it.

User avatar
Tero
Just saying
Posts: 51260
Joined: Sun Jul 04, 2010 9:50 pm
About me: 15-32-25
Location: USA
Contact:

Re: Derails from Climate Change News thread.

Post by Tero » Tue Jun 17, 2014 11:14 pm

Another Seth, elsewhere
J: True, that's why we have adapted and learned to use irrigation. We may need to pump more water from wet areas to dry areas. Adaptation really works well historically.

BPL: No, historically civilizations subject to massive drought collapse. Google the following terms: Mohenjo-Daro. Harappa. Mayan Empire. Anasazi.

User avatar
Tero
Just saying
Posts: 51260
Joined: Sun Jul 04, 2010 9:50 pm
About me: 15-32-25
Location: USA
Contact:

Re: Derails from Climate Change News thread.

Post by Tero » Wed Jun 18, 2014 12:21 am

mistermack wrote: SEE POST ABOVE

The orange line is what they forecast if CO2 levels remained at year 2,000 levels. They haven't.
But temperatures are still actually below the 1997 levels, that are shown on the graph.

Way outside their forecasts. Because their forecasts are just wild guesses, dressed up as science.
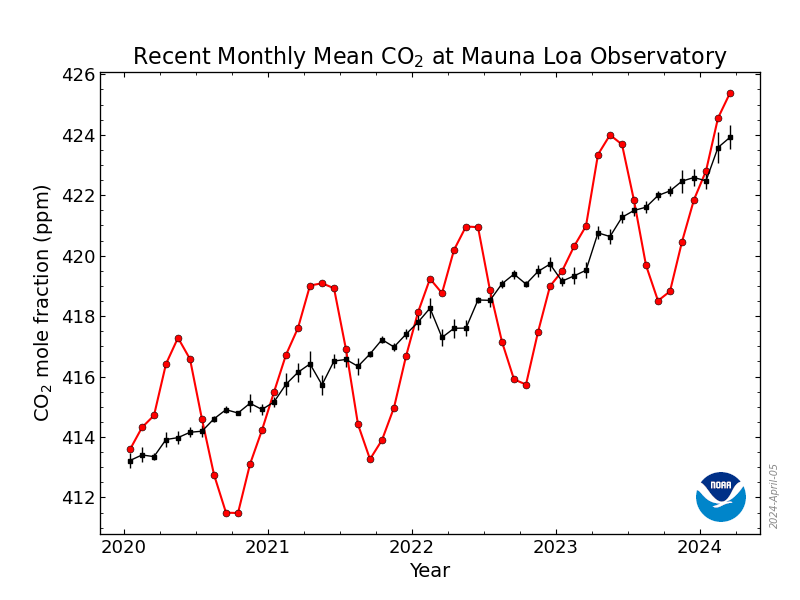
CO2 keeps going up as it has the entire time. No pauses.

Image

User avatar
macdoc
Twitcher
Posts: 9012
Joined: Tue Feb 23, 2010 3:20 pm
Location: BirdWing Home FNQ
Contact:

Re: Derails from Climate Change News thread.

Post by macdoc » Wed Jun 18, 2014 12:25 am

he orange line is what they forecast if CO2 levels remained at year 2,000 levels. They haven't.
But temperatures are still actually below the 1997 levels, that are shown on the graph.
Oh ?? you thnk continuing to repeat wrong information will make it true??

Do you understand 1997/98 was an outlier year due to El Nino??
Do you even know what that is?
Here I'll explain it...ENSO comes in two forms ....El Nino and La Nina...During LaNina periods heat is taken up by the ocean
During El Nino it is released.
Here is the graph showing the 1998 El Nino anomaly which you want to cherry pick.

Image

This is the temperature graph without the El Nino spike

Image
here is very little justification for asserting that global warming
has gone away over the past ten years, not least because the linear
trend in globally-averaged annual mean temperatures (the standard
yardstick) over the period 1998-2007 remains upward. While 1998 was
the world’s warmest year in the surface-based instrumental record up
to that point in time, 2005 was equally warm and in some data sets
surpassed 1998. A substantial contribution to the record warmth of
1998 came from the very strong El Niño of 1997/98 and, when the
annual data are adjusted for this short-term effect (to take out El
Niño’s warming influence), the warming trend is even more obvious.

Because of the year-to-year variations in globally-averaged annual
mean temperatures, about ten years are required for an underlying
trend to emerge from the “noise” of those year-to-year
fluctuations. Hence, the fact that 2006 and 2007 were cooler than
2005, is nowhere near enough data to clearly establish a cooling
trend.
Global warming stopped in 1998. Global temperatures have remained
static since then, in spite of increasing concentrations of greenhouse
gasses in the atmosphere. Global temperatures have cooled since
1998. Because 2006 and 2007 were cooler than 2005, a global cooling
trend has established itself.
All these statements, and variations on them, have been confidently
asserted in the international and Australian media in the past year or
so, but the data do not support them
.

How would you explain this??....do you really think the atmosphere is the only indicator of AGW?

Image

and this should be a very interesing year., as Godzilla aka El Nino surfaces...

Image

You make a foolish statement about global temperature and can't even support it with data or an an explanation of why the laws of physics regarding
CO2 traps IR ..which you finally acknowledged....
are suddenly changed
and people are supposed to be swaying by your handed down wisdom...
:funny: :funny: :funny:
Resident in Cairns Australia • Current ride> 2014 Honda CB500F • Travel photos https://500px.com/p/macdoc?view=galleries

User avatar
Tero
Just saying
Posts: 51260
Joined: Sun Jul 04, 2010 9:50 pm
About me: 15-32-25
Location: USA
Contact:

Re: Derails from Climate Change News thread.

Post by Tero » Wed Jun 18, 2014 12:29 am

For mm only:
http://www.mitosyfraudes.org/Warming.html
enjoy! you could form a club with him and build a treehouse! no girls allowed!
he is at funareco@gmail.com

User avatar
macdoc
Twitcher
Posts: 9012
Joined: Tue Feb 23, 2010 3:20 pm
Location: BirdWing Home FNQ
Contact:

Re: Derails from Climate Change News thread.

Post by macdoc » Thu Jun 26, 2014 11:29 pm

Resident in Cairns Australia • Current ride> 2014 Honda CB500F • Travel photos https://500px.com/p/macdoc?view=galleries

User avatar
macdoc
Twitcher
Posts: 9012
Joined: Tue Feb 23, 2010 3:20 pm
Location: BirdWing Home FNQ
Contact:

Re: Derails from Climate Change News thread.

Post by macdoc » Tue Jul 01, 2014 8:59 pm

Image

we really are amazing....that this pile of humans ....parked in the Grand Canyon.....have managed to screw up a very nice planet....
A Pile of Mammals Smaller Than a Single Canyon Is Dominating the Entire Planet

Written by BRIAN MERCHANT
April 30, 2014 // 06:25 PM CET


If you took every human being on Earth and put them in the Grand Canyon, they wouldn't even begin to fill it up. The seven billion-strong lot of us would make a pretty formidable pile, sure, but we'd get nowhere close to an overflow. At least, not according to this 'species portrait' put together by VSauce and recently shared far and wide across the blogland.

The visualization proved so popular because it turns our working conception of the size and scope of humanity on its head—we are a vast and multiplying species; we blanket the entire planet with our cities and settlements. Jesus Diaz notes that "Even if you took all of humanity across all the ages—an estimated 106 billion—the piles—about 15 of these—wouldn't cover the Grand Canyon. Not even a significant fraction."
http://motherboard.vice.com/en_ca/read/ ... oardCanada
Resident in Cairns Australia • Current ride> 2014 Honda CB500F • Travel photos https://500px.com/p/macdoc?view=galleries

Post Reply

Who is online

Users browsing this forum: Bing [Bot] and 4 guests